
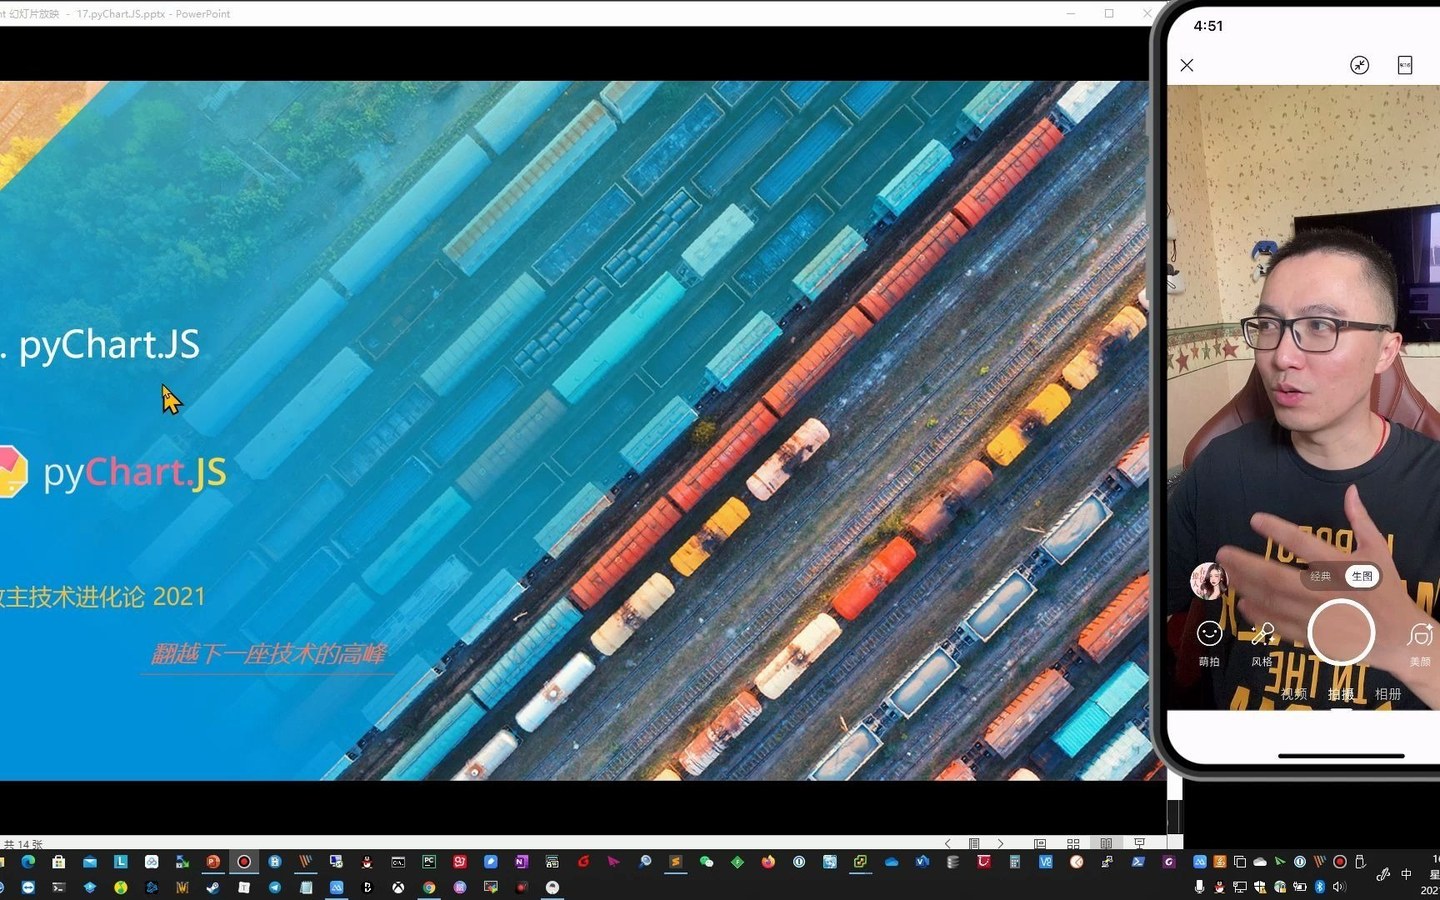
Course Introduction
This episode uses pyChart.JS to generate Chart.js data and web charts from Python. It covers data structures, chart types, labels, frontend-backend transfer, and lightweight interactive visualization of automation results.
Total recording duration: 21 min 10 sec.
Companion Git repository: https://github.com/IridiumIO/pyChart.JS
Companion Git repository: https://qytgit.qytang.com/qytadmin/djang_course_2021_4
COURSE RECORDINGS
Course Video
Watch the full recording here or open it on the original video platform.
BILIBILI01