
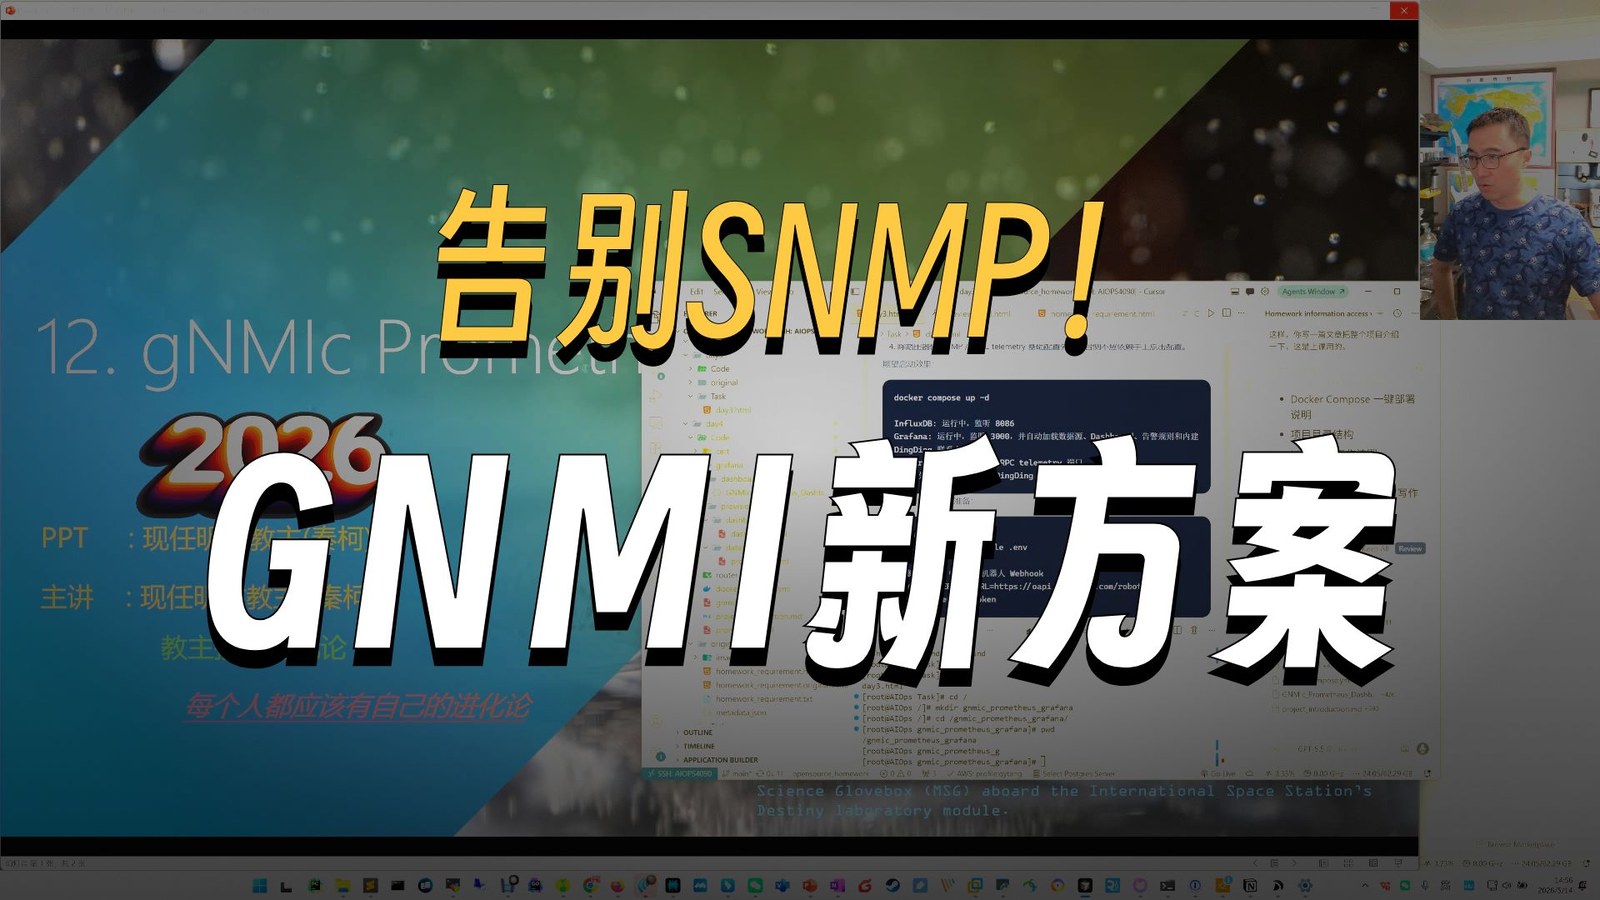
Course Introduction
This episode builds a gNMI-based network telemetry pipeline. gNMIc subscribes to device metrics, Prometheus stores and queries the time-series data, and Grafana visualizes it. The course covers subscription paths, labels, collection intervals, validation, and a reproducible monitoring workflow for network-device performance.
Total recording duration: 11 min 34 sec.
Companion Git repository: https://qytgit.qytang.com/qytadmin/2026_12_gNMIc_Prometheus_Grafana
COURSE RECORDINGS
Course Video
Watch the full recording here or open it on the original video platform.
BILIBILI01
FULL SESSION
2026 Evolution Ep. 12: gNMIc, Prometheus, and Grafana
12 MIN
Watch on the Original Platform