
Course Introduction
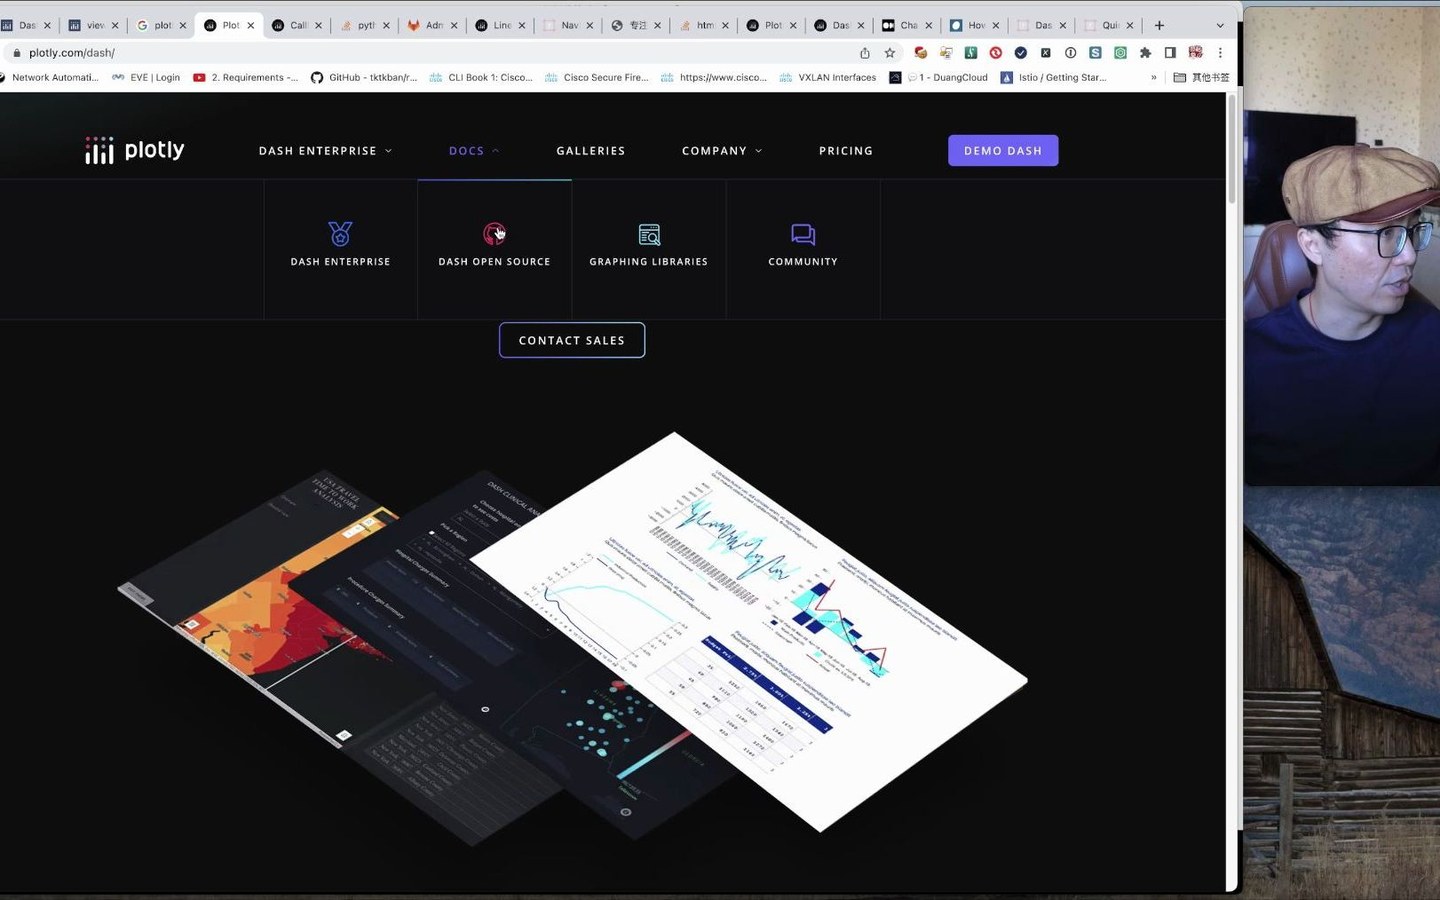
This episode builds an interactive data-visualization application with Plotly Dash, covering application structure, components, callbacks, charts, and page layouts. Python ties data processing, interaction logic, and browser presentation into one workflow.
Total video duration: 28 min 29 sec.
Companion Git repository: https://qytgit.qytang.com/qytadmin/2023_3_plotly.
COURSE RECORDINGS
Course Video
Watch the full recording here or open it on the original video platform.
BILIBILI01